Contents
- Index
The 5 Steps to U-Tab (printable tutorial)
U-Tab is an easy, intuitive software tool that allows you to analyse, report, and chart data. Whilst its primary use is intended to be the analysis of data from quantitative surveys, it can equally well be used to analyse and report data from any source.
Typically the bulk of the data contained within any U-Tab project will be numerical, but there is also a facility to incorporate free-form comments or any related information within the software.
Analyses of the data produced within U-Tab can be printed, charted, exported to MS-Excel or copied to any Windows application via the clip-board. There is also a powerful export facility that allows you to export part or all of the database into MS Access, or other database programmes.
This tutorial is for users who have only recently started using U-Tab and is designed to guide you through the 5 basic stages of use:
1. Creating a table
2. Changing the table
3. Changing the appearance of the table
4. Creating output
5. Saving the table
_______________
1. Create a table
U-Tab operates by allowing users to produce their own cross-tabulations from the data. These cross-tabulations can be refined and the results displayed in a wide variety of ways.
The project file is delivered without pre-formatted tabulations and U-Tab will, by default, open with a cross-tabulation of the first question by the last banner. Users create their own cross-tabulations by selecting any combination of variables and banners. These can be continuously refined, allowing users to investigate significant results from one cross-tabulation by drilling further down into the detail. This avoids having to specify in advance which cross-tabulations are going to be required, thus anticipating the results of the research, and also saves having to specify additional cross-tabulations after the results have been published. Also, those who run Tracking Studies will find the scripting option useful in that it allows for a number of specific cross-tabulations to be prepared and exported to Microsoft Excel or PowerPoint in one go.
Users specify their cross tabulations by selecting the Title for the table they wish to run and the breaks (or Banner) with which they wish to analyse that data. The Title determines the row headings, or side heads of the resultant table, while the banner determines the column headings.
Cross tabulations can be further refined by adding as many as three filters, or bases.
The title, banner and bases are all selected by choosing a variable that the user is interested in from a pop-up list of all the variables held in the project file. The analyses can be further refined using filters or by specifying new variables constructed from the variables already held.
When you download U-Tab for the first time you will receive an example project file, called 'Galahad Beer' to experiment with. Use this file to investigate the software, click and right-click anywhere and you will find an array of useful functions to try out.
Once loaded, other project files can be opened by clicking on the Open File icon from the Toolbar, or by using the File | Open menu.
Select File | Open to open the Open File dialogue box
By default U-Tab looks for project files, but can also be used to search for project back-up files (with a .wbu extension) or expanded files (with .wsp extensions) if your data set is particularly large. Also, you can double-click any of these file types to open them from the Windows Explorer.
This example project that comes with U-Tab is perfect for learning the ropes and contains enough information for the new user to experiment with all the functions of U-Tab without risking sensitive data files. Press F9 to calculate the initial tabulation of the first title variable by the last banner from the project file. What is now displayed is the first table in the project file, calculated by the elements of the title and banner.
If you're using U-tab for the first time you'll notice the mouse-pointer will move to the left of the screen, exposing the variable index. That's where all the variables are listed and it collapses on the left to maximise the user's workspace. If you want to see it simply move your mouse-pointer to the left margin and it will pop up. If you want to hide it again, simply move your mouse-pointer off the index. As with most functions in U-Tab, there is a pre-defined shortcut keystroke for toggling the variable index: ctrl+i. This feature can be adjusted in terms of sensitivity or even switched off by using the options menu. Without the variable index expanded, this is what you'll see on your screen:
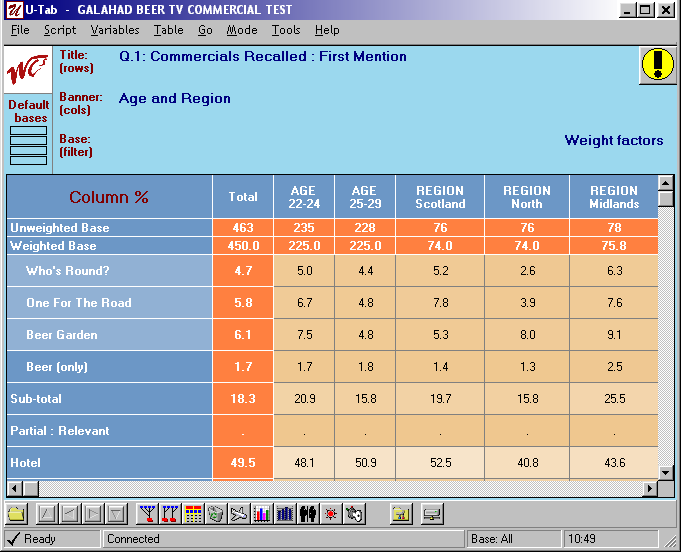
Very simply, you're looking at two areas: the table construction area:
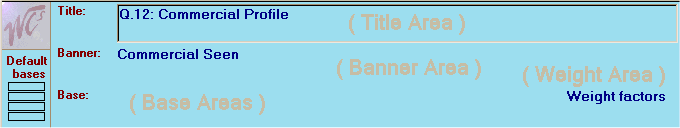
This field can be further divided into 5 areas:
Title Area
This displays the name of the variable being used to define the title
Banner Area
This displays the name of the variable being used to define the banner
Base Areas
This displays the variable code being used as a filter for the table
Default Base Indicators
These bars will be coloured to indicate a default base in the table being displayed. The user would have pre-defined these bases when requesting the project file. As the user progresses through the list of tables they will be able to see if there are multiple bases applied to the then-current table. There can be up to 4 default bases applied to one table at a time.
Weight Area
This indicates whether a weighting factor has been applied to the table or not. The title of the weighting factor being applied will appear in this area and by hovering your mouse here, you can see the minimum and maximum weights that were applied to the table.
...and the table display area:
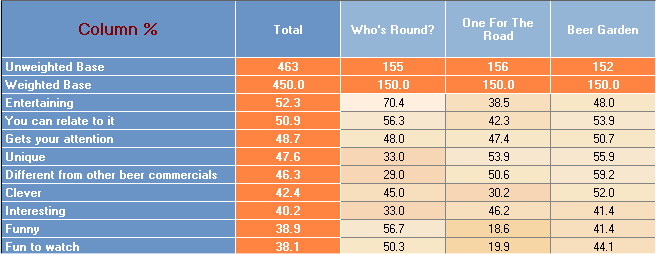
The Table Display Area is the area in the centre of your screen and displays the table defined in the table display area. The user will be able to identify the following areas here:
Table body
This shows the cross-tabulation.
Fixed cells
The fixed cells around the table body show appropriate totals for the data in the columns and rows.
Headers
The row and cell headers contain the labels that describe the parameters of the selected title and banner. The title points are described in rows and the banner points are described in columns.
Data type indicator cell
The cell at the intersection of the row and column headers indicates the format of the data being shown in the table body. By clicking on this cell the user cycles through the formats in which the table's numbers are displayed, namely raw numbers, column percentages, row percentages, global percentages and row indices (see below for definitions).
Raw numbers: This displays the sum of responses for each cell
Column percentages: This expresses the number of responses in each cell as a percentage of the total number of responses in the appropriate column (or banner point).
Row percentages: This expresses the number of responses in each cell as a percentage of the total number of data items in the appropriate row.
Total volume or Global percentages: This expresses the number of responses in each cell as a percentage of the total number of responses for that table.
Row indexes: This expresses the column percentage of each cell indexed on the average percentage or the entire row.
At the very top of your screen is the menu bar which contains various drop-down menus:
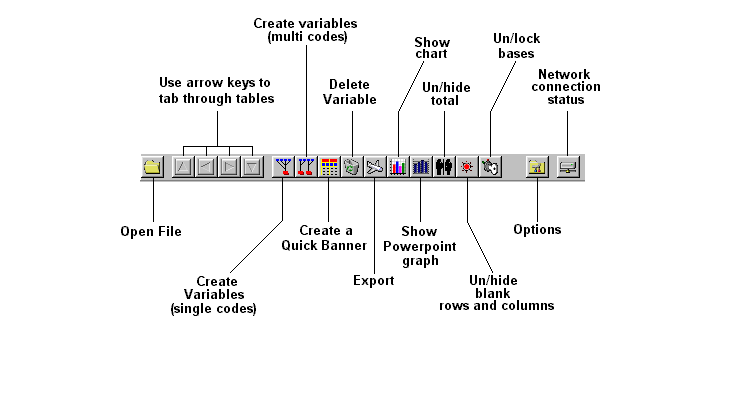
Below the table area are the tool bar that shows short-cut icons and the information area that displays helpful information regarding any current processes of U-Tab. This toolbar houses 17 icons, all of which are shortcuts to frequently used functions of U-Tab.
The function of each icon is detailed in the diagram below:
For more information regarding related topics, please follow the links:
Short-cut keys
Options menu
_______________
2. Change the table
U-Tab allows the user to use either the drag 'n' drop principle when creating tabulations, button clicks, or the right-click menu. You can choose whatever method you are most comfortable with.
Drag 'n' drop:
When selecting a variable as a title, banner or weighting, simply click on and drag said variable from the Variable Index onto the appropriate area in the Table Construction Area. Note that U-Tab can tabulate very large data files and although it is fast, these can take a noticeable time to compile. For this reason, if you want to use the drag-drop technique but need to change the banner or bases before you compile the table, hold down the Shift Key when you drop the variable. This will keep the Variable Index open for the user's next selection.
To apply a base the user would follow similar actions as those detailed above. Open the variable index, click on the red book icon to expand the default bases, drag and drop the selected base's icon onto the bases area and the selection will be used as the base applied to the table.
Button clicks:
Once you have selected a variable from the Variable Index, simply click one of the buttons at the top of the Index to add it to either the Title, Banner or Base Areas. Your new table will be run instantly.
Right-click menu:
Simply right-click a variable from the Variable Index, and select from the pop-up menu the command to add it to either the Title, Banner or Base Areas. You can continue defining other variables until you select calculate or press the short-cut key F9.
Weighting:
If you'd like to see the table without the weighting applied, right click the weight factor box and select Clear Weight. You'll notice the weight factor box is cleared of text and the data in the table reflects a non-weighted output. In order to reselect the weighting factor, move your mouse-pointer toward the left margin and when the variable index pops up, click on the expandable Numeric Variables icon. The red book icon will change to an open book icon to reveal the weight factor variables. Drag and drop this variable onto the weight factor box to re-instate it as the weighting factor. When selecting a variable for use as a weighting factor, the user must select a numeric variable. U-Tab will inform the user of an unsuitable variable by way of a pop-up message.
Bases:
Once you have added a base (or a filter) to your table you will notice that the bases become "locked"...
When the base of the table is locked the key icon will appear greyed-out and the user is able to manipulate the title and banner descriptions freely without losing the base definition.
As an exercise open the example project, and select a base of married respondents from the Sample Characteristics section. To do this, select Marital Status and drag it to the base area (or click the Base button), then choose Married from the pop-list.Your table will be-recalculated on this new sub-sample and when you change the title or banner you will notice the base will remain constant. Now unlock the base by clicking the lock/unlock base icon. The base window will flash red and the base will be cleared. This allows the user to combine any title and banner combination with any bases or series of bases, as described below.
Having defined the base(s) that best serve your tabulations, U-Tab offers the user the option of retaining that base combination indefinitely by saving the base. Simply right-click a base area and select save base. You'll find that if you change your title then come back to your original table again, the base will appear in a white box, indicating it's status as saved. To clear the saved base, simply right-click the base box and select clear base and to clear it permanently, save the "empty" base.
You might find that you want to go one or two levels deeper into your post-analysis. That's easy with U-Tab: by selecting multiple bases you are effectively filtering and re-filtering your result until you're left with the appropriate sample. To do this, simply drop variables on any of the three base areas.
Occasionally, you may find that being able to define three independent bases to a table is not enough to get to the segment you want to analyze, or you may want to net several responses together and create a merged code. These are situations when you need to create a new variable.
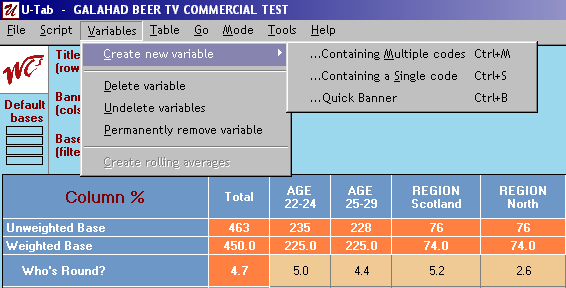
Creating a new variable:
The toolbar houses 3 icons for creating new variables. The first is for creating a new variable containing a single code which you would usually use to create a new base. The second is for creating a new variable containing a list of multiple codes which you would usually use to create a new banner or net some codes together and the third is the Quick Banner option which is an easy way to create a simple banner made up from two existing variables e.g. Age within Gender.
Creating a Single code variable:
A single code variable is constructed by selecting individual codes from existing variables and combining them to form a new, complex code. The process involves:
Selecting the variables that contain the codes you wish to use;
Selecting the appropriate codes from those variables, and
Defining how those codes are to be combined to create the new variable.
This is all done within the single code variable construction dialogue box.
Define the new variable
To define the new variable identify the codes that will make up the new variable and how they will be combined.
For example you may wish to create a variable that captures all those respondents in either of two age groups, but which excludes those who are self-employed.
Open the single code variable construction dialogue box
Either
Click on the single code construction icon on the tool bar
Or
Select Variables|Create new variables |Containing a Single code, or use the short cut key: Ctrl+S
You will see:
The variable construction window
The window used for constructing single code variables has four main areas:
Variable titles list
This displays the index of all the variables in the project database, including any user-defined variables
Variable codes
This displays the codes of any variable that has been selected and from which the new variable will be constructed.
Conditions created
This is used to define the way in which the codes of any one variable will be combined to form the new variable.
New code
This displays the definition of the new code and any name you have assigned to it.
Create the variable:
From the Variable titles area, select the first of the variables that contains codes that you wish to use in the construction of the new variable. The codes of this variable will now appear in the Variable codes area.
Select the codes that you wish to work with by highlighting them in the Variable codes area. To select more than one code at a time hold the Ctrl key down as you select them. To select a range, click the first code then holding the Shift key down, select the last.
To add the selected code to the list of conditions that define a particular sub-set, click on the AND button to the right of the Variable codes area
To exclude the selected codes in the definition of the new variable, click on the NOT button to the right of the Variable codes area
The conditions created will be reflected in the Conditions created area. All conditions in the list must be satisfied.
Select the next variable that contains codes that you wish to use to filter the new variable and continue as above.
When you are satisfied that the Conditions created area correctly defines the first group you are interested in, click on the Add button to the right of this area. The definition will now appear in the New code area.
Repeat the above for other sub-sets that you wish to add.
If you make a mistake while constructing your codes, use the Clear button to the right of the Conditions created area to start again.
If you have added a code to the New Variable list and then changed your mind, use the Delete button to the right.
Enter a title for the new variable by selecting (Title) in the uppermost box of the New code area and entering a title.
If you are satisfied with the definition and the title of the new variable, click on the Write code button in the top right hand corner of the screen.
The new code will now be written and added to the project file. The new variable will appear in the variable index at the bottom of the index in a new folder titled User-defined variables.
Creating a Multiple code variable:
To create a new variable containing a list of multiple codes:
A multiple code variable is constructed by selecting individual codes from existing variables and combining them to form a new, complex variable. The process involves:
Selecting the variables that contain the codes you wish to use;
Selecting the appropriate codes from those variables, and
Defining how those codes are to be combined to create the new variable.
This is all done within the single code variable construction dialogue box.
Define the new variable
To define the new variable first identify the codes that you wish the new variable to be made up of, and then identify the codes of existing variables that you will make up the new variable and how they will be combined.
For example you may wish to create a variable that uses wider age bands than is contained in existing variables. You would do this by taking the existing Age variable and combining some of the codes into a smaller number of codes.
Open the multiple code variable construction dialogue box
Either
Click on the multiple code construction icon on the tool bar
Or
Select Variables|Create new variables |�.Containing Multiple code
Or use the short cut key: Ctrl+M
You will see:
The variable construction window
The window used for constructing single code variables has four main areas:
Variable titles list
This displays the index of all the variables in the project database, including any user-defined variables
Variable codes
This displays the codes of any variable that has been selected and from which the codes of the new variable will be constructed.
Construction area
This is used to define the way the codes for the new variable and the way in which each code is constructed.
New variable list
This displays the definition of the new code and any name you have assigned to it.
Create the variable:
From the Variable titles list, select the first of the variables that contains codes that you wish to use in the construction of the new code. The codes of this variable will now appear in the Variable codes area.
Select the codes that you wish to work with by highlighting them in the Variable codes area. To select more than one code at a time hold the Ctrl key down as you select them. To select a range, click the first code then holding the Shift key down, select the last.
You now have four options in using the selected codes to define the new code: you can simply Add them to the Construction Area, Merge them with codes you previously added to the Construction Area, Net/Roll selected codes, or use the code to create a Condition which the new code must satisfy. The effect of each of these is as follows:
Add
Adds the selected codes to the Construction Area to form codes of the new variable
Net/Roll
Nets the selected codes into one new code and adds this to the Construction Area to form a code of the new variable. If the codes define a time-line, you will be given the option to "roll" codes together to form a "moving average".
Merge
Merges selected codes with those already in the Construction Area on a one-to-one basis. The number of selected codes must equal the number of codes already in the Construction Area.
If, for example, if you had a list of companies people had press advertising awareness of, you could add this to the Construction area, then Merge these with a list of companies people had television advertising awareness of. The resulting variable would then contain the combination of the two.
Condition
The selected code (single code only) will be used to define a condition (or filter) for the codes listed in the Construction Area. You can then use the drop-down combo box to select the Logical Operator (OR, AND, or NOT) you require.
If the code you use to define a condition is a numeric value (e.g. actual age), you will need to specify the range that this variable needs to meet to satisfy the condition.
Use the pull down menu to specify which operator (i.e. greater than, equal to etc) you wish to use.
When you are satisfied that the Construction area correctly defines the codes you wish to make up the new variable, either click on the Add button to the right of this area or the Not button if you have defined the respondents you don't want in the new variable. The code definitions will then appear in the New variable area.
You can repeat the above, adding more codes to your new variable using different conditions until you have defined all the new codes that you require.
If you make a mistake while constructing your codes, use the Clear button to the right of the Construction area to start again.
If you have added a code to the New Variable list and then changed your mind, use the Delete button to the right.
Enter a title for the new variable by selecting Title in the uppermost box of the New variable area and over typing your selected label.
If you are satisfied with the definitions and the title of the new variable, click on the Write code button in the top right hand corner of the screen
The new code will now be written and added to the project file. The new variable will appear in the variable index at the bottom of the index in a new folder titled User-defined variables.
Having created the variable you may wish to edit the names of the codes to produce more user-friendly alternatives. This can be done by running a table using the variable and editing the labels by double-clicking on them.
Creating a Quick Banner:
To create a quick banner:
A quick banner combines two existing variables by analysing the data by one variable within another. A typical quick banner might be constructed to analyse responses by age within gender.
Open the quick banner construction dialogue box
Click on the Create Variable (Quick banner) construction icon on the tool bar
The dialogue box is made up of three areas:
Variable titles
This displays the index of all the variables in the project database, including any user-defined variables
Banner variables (Levels 1 and 2)
For each of the two variables selected to make up the new banner, this shows the codes of that variable
New banner
This shows the result of combining the two variables. It lists all the permutations of the codes of the two variables, as well as showing the default title of the new banner.
Create the variable
From the Variable titles area, select the two variables that you wish to use in the construction of the new banner. The codes of the first variable selected will appear in the left-hand box in the Banner variables area and the codes of the second variable selected will appear in the right hand box.
The New banner area will now show the default title of the new banner and the default codes. Codes can be deleted from the banner by selecting them and clicking on the Delete button in the top right hand corner of the New banner area.
If you are satisfied with the definition and the title of the new variable, click on the Write code button in the top right hand corner of the screen
The new code will now be written and added to the project file. The new variable will appear in the variable index at the bottom of the index in a new folder titled User-defined variables.
_______________
3. Change the appearance of the table
Changing the display
Every element of the U-Tab interface can be formatted to your requirements. Colours, font sizes and styles, can all be changed and there are several options that alter the way that the tables and the titles are rendered, and how numbers are formatted.
Any changes made can be saved as a Theme so that they are preserved for future use, and there is also a wide variety of pre-formatted themes, for you to choose from.
You can also amend the titles, banners, bases, and row and column headings for improved clarity, brevity, or relevance.
Many of the physical attributes of a table can be changed using the Options dialog box, which has five tabs. The first three enable you to customise the Format, Navigation and Export and printing options, the fourth allows you to choose from a number of pre-set Themes, and the fifth allows you to customised a number of specialised features. The Format tab in the Options dialog box (see picture below) contains six coloured areas. Right-click on them to alter the element's background colour and left-click on them to alter font attributes.
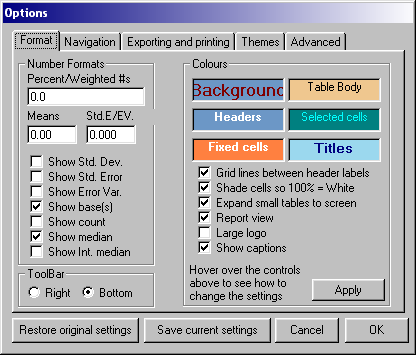
Beneath these 6 fields, on the Format tab, are 6 checkboxes that further alter the screen display:
Grid lines between header labels:
Shows or hides grid lines that separate row and column labels.
Shade cells so that 100% = white:
When checked, a graduated colour scale is used to highlight large figures, helping you to quickly see differences within the table body.
Expand small tables to screen:
Controls whether tables with few columns and/or rows have their column widths and row heights automatically adjusted so that they fill the screen.
Report view:
When U-Tab is in Report view mode the title, banner, base and weight area borders are invisible until you move your mouse over them. When unchecked these areas are always bordered and the screen background colour is unchangeable.
Large logo:
If you don't want to see the default base indicators and are familiar with the positions of the title, banner and base areas you can make the logo in the top left of the screen larger. Note that your own logo can be added to the U-Tab screen for distribution with your project files. Please contact Weeks Computing Services for details.
Show captions:
Displays or hides the title, banner or base labels.
Formatting and editing text
Every element of the U-Tab interface can be formatted to your requirements. Colours can be changed as well as font sizes and styles. There are also several options that alter the way that the tables and the titles are rendered, and how numbers are formatted.
Use the Format tab on the Options dialog box to customise your screen and save your Theme so that your settings are quickly available.
Both variable names and code labels can be amended or replaced with new text, and the amendments made will be reflected in all future occurrences of the amended name or label. In addition code labels can be split over several lines by using a line break or hard return, although variable names cannot.
All editing of variable names and code labels is done in-place on the table you are currently viewing.
To amend a variable name
Select the variable, the name of which you wish to amend, as a title or banner of a table
Double click on the text you wish to change.
Make the amendments required by inserting or deleting text, or over typing. Once you are satisfied with the amendments you have made, move the mouse over the control box and select Save.
If you wish to abandon your changes, move the mouse over the control box and select Cancel.
To amend a code label
Select, as a title or banner, the variable that contains the code label you wish to amend.
Double click on the text you wish to change and use the same process as described above.
NB Once changes to a variable name or code label are made in one table, the old text is lost from the U-Tab file.
Editing text can be done live by double-clicking on any textual element on the U-Tab screen and affecting your changes.
Note that since side heads and banners are interchangeable in U-Tab, any changes you make to text while it is displayed as a banner will be there when you use the same variable as a side head.
Exactly the same technique is used to edit your variable names. Double-click on the Title, Banner or Base areas to edit them.
NB One exception is that code labels (side heads and/or banner labels) can contain 'line breaks' or 'hard returns', variable names cannot.
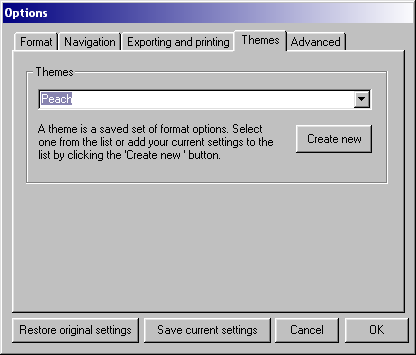
Saving the new theme
The Themes tab on the Options dialog box (see below) allows all current formatting options to be saved as a theme. Several users can therefore set up their own options and quickly access them from this page.
Hiding columns and rows
Areas of the table may be hidden from view by selecting the columns or rows you wish to hide, then right-clicking and selecting the hide selected column(s) or hide selected row(s) option.
Hidden areas are not charted or exported, so you can use this technique to build custom charts, or paste data into specific areas of an Excel report.
Transposing tables
You can quickly transform your table by swapping the Title and Banner without recalculating. Do this by right-clicking either the Title or Banner areas and then selecting Transpose title and banner from the pop-up menu.
Transposing tables is particularly useful if you need to export a large table to Excel (since Excel only supports 256 columns per sheet).
Also, since means are only displayed in rows, you can use this command to show means as columns.
If a project file has been used to hold verbatims these can be viewed from any table other than those which use a numeric variable either as a title or a base. U-Tab requires you to select a particular cell within the table and view the comments made by those respondents whose answers are captured in that cell. For example, if you are analysing awareness of an advert by age, and one of the cells records respondents who showed unprompted awareness of a particular advert by those aged 25 - 35, U-Tab allows to view the comments made by the 25 - 35 year olds who showed unprompted awareness of that advert.
Viewing verbatims
This options allows you to view, from a table, those verbatims made by a sub-set of respondents and which have been coded to the variable used as a title for that table.
To view the verbatims:
Locate the cursor in the cell that defines the group of respondents whose verbatims you wish to view
Right click to reveal a pull-down menu
Select View verbatims. If this option is greyed out, there are no verbatims. If there are no verbatims coded to that variable a warning will appear.
If there are verbatims coded to that variable these will be displayed in a Verbatim window. If there are more verbatims than will fit in the window there will be a scroll bar at the right edge of the window to allow you to scroll up and down the list.
You can now copy the verbatims to another program (such as MS Word) and print them from there.
To close the Verbatim window
Click on Done.
Viewing all verbatims
This option allows you view, from a table, all the verbatims made by a sub-set of respondents. The set of respondents is defined by one of the cells in the table.
To view the verbatims:
Locate the cursor in the cell that defines the group of respondents whose verbatims you wish to view
Right click to reveal a pull-down menu
Select View all verbatims. If this option is greyed out, there are no verbatims.
If there are verbatims will be displayed in a Verbatim window. If there are more verbatims than will fit in the window there will be a scroll bar at the right edge of the window to allow you to scroll up and down the list.
You can now copy the verbatims to another program (such as MS Word) and print them from there.
Viewing a customised selection of verbatims
If the original questionnaire has more than one question asking for comments, U-Tab also allows you to view the verbatims from a customised selection of the questions.
Locate the cursor in the cell that defines the group of respondents whose verbatims you wish to view
Right click to reveal a pull-down menu
Select View all verbatims. If this option is greyed out, there are no verbatims.
The labels of all the questions containing comments will appear in a list to the right hand side of the Verbatim window, together with check boxes. To select verbatims for only some of the questions listed:
Un-check those questions that you do not want reported
Click Done
Re-produced the verbatims by right clicking on the appropriate cell and selecting View all verbatims.
Copying verbatims
To copy the verbatims to another program:
Click on Copy to clipboard. This will place the verbatims on the clip board from where they can be copied as normal.
_______________
4. Creating some output
Tabulations in U-Tab can be printed, plotted to a graph, charted and exported to the MS Office suite.
Graphing and Charting
On the toolbar, click the Show Graph icon.
U-Tab will create an MS PowerPoint graph with your data and display it on the screen. All typical MS PowerPoint tools are applicable when viewing this graph, including various graph types and settings. Click 'done' when finished. To Print a Graph, select Export to MS PowerPoint from the File drop down menu. Once the graph has been exported, select Print from the File drop-down menu.
Using the same table, click the Show Chart icon on the toolbar.
A number of chart types are available from the Options drop-down menu. Cycle through them to select the most applicable chart type. The chart window appears as soon as you create a new table and by default covers the grid area of the U-Tab window. Moving over the left edge of the chart window brings the grid and Variable List back into view. You can also switch from the table grid to the chart by clicking on your task bar. To Print a Chart, select Print from the Chart drop-down menu. If you have enough screen area you can resize the chart window so that it appears outside the main U-Tab window.
Charts can be pasted into other applications (e.g. MS-PowerPoint, MS-Word and MS-Excel) by clicking on the copy to clipboard menu item. Use the Paste-special function in other applications to see the various data formats supported.
Helpful hint:
To print the U-Tab table, select Print table from the File drop-down menu. Also, please contact us if you have any specific needs and we will add them to the package.
Exporting tables
U-Tab tables can be exported into MS-Excel preserving full text formatting. Fonts and cell sizes are duplicated in Excel so that your exported table looks as near as possible to the original U-Tab table. Click the Export icon on the toolbar to export your current table to Microsoft Excel.
If you don't want formats to be applied to your Excel file uncheck the retain formats checkboxes on the Export and printing tab in the Options screen.
Note that Excel has a limit of 256 columns to a sheet. If your table has too many banner points you can either transpose the table before exporting, or hide some of your columns and export the table in sections.
_______________
5. Saving the table
In most cases, U-Tab is so fast that returning to a previously created table can be done by recreating it from scratch. However, if your sample is very large (500,000+), table creation can take several seconds. You can therefore save tables to file for instant recall.
To save a table, use the File drop-down menu command Go | Save table. You will see a new entry in the Go menu that describes your saved table. You can store as many tables as you wish and then view them by clicking on their titles in this menu.
All elements of your table are stored, including column and row spacing and also your last position within the table data.
_______________
For a more detailed insight into U-Tab, please consult the main help file. Click here to be taken directly to the contents page.