Contents
- Index
Interpolated Medians
Along with all the usual statistical measures associated with numeric variables (Mean, Median, Standard Deviation, Standard Error, Error Variance), U-Tab will also calculate an "Interpolated" median, which although non-standard can be an extremely useful measure when dealing with "banded" numeric ranges (e.g. age, income) or situations where the total range of answers to a question is relatively narrow (e.g. scalar ratings, household size).
The Interpolated Median can be thought of as the calculated estimate of where the true median would have been had there been less granularity in the scale used. Specific examples would be exact measures in the case of banded questions, or more detail in the case of scalar data.
The principle used is to use the 'distance' along the group of identically scoring respondents of the middle case in the sample to create a ratio that can be applied to the mid-points between the previous and next scores in the data.
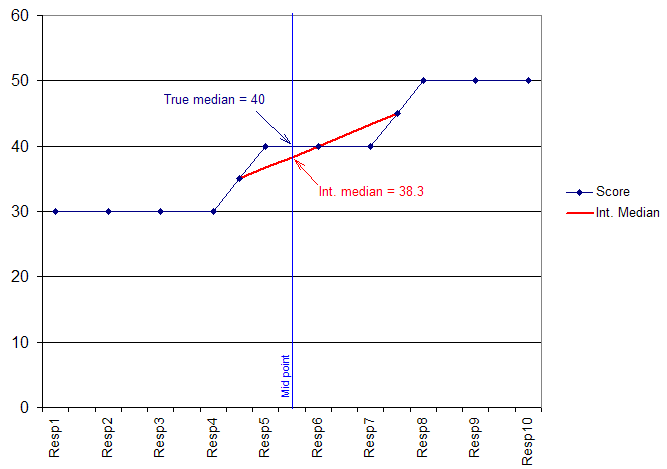
Perhaps best explained in a diagram, the following chart shows 10 respondents who have given their answers to a banded age question:
4 said they where aged between 25 and 34
3 said they where aged between 35 and 44
3 said they where aged between 45 and 54
We have to assume mid-points of each range so our true median would be shown as 40, however, the middle case (5Ẅth person) is closer to the group of younger respondents than the older ones. Our resulting Interpolated median is therefore slightly lower (38.3).