Contents
- Index
Table Display Area
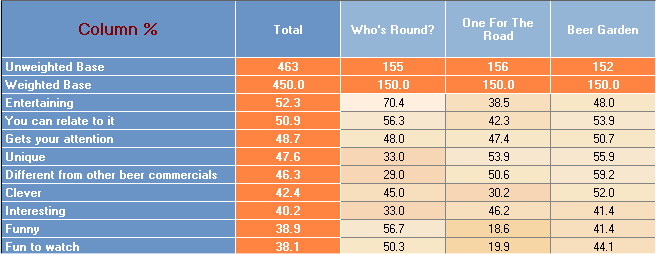
Table body
This shows the results of the data analysis.
Fixed cells
The fixed cells around the table body show appropriate totals for the data in the columns and rows.
Headers
The row and cell headers contain the labels that describe the parameters of the title and banner selection. The title points are described in rows and the banner points are described in columns.
Data type indicator cell
The cell at the intersection of the row and column headers indicates the format of the data being shown in the table body. By clicking on this cell the user cycles through the formats in which the table's numbers are displayed, namely raw numbers, column percentages, row percentages, global percentages and row indices (see below for definitions).
Raw numbers: This displays the number of responses or data items in each cell
Column percentages: This expresses the number of responses or data items in each cell as a percentage of the total number of data items in the appropriate column, or banner category
Row percentages: This expresses the number of responses or data items in each cell as a percentage of the total number of data items in the appropriate row
Total volume or Global percentages: This expresses the number of responses or data items in each cell as a percentage of the total number of responses
Row indexes: This expresses the number of responses or data items in each cell as a percentage of the average number of responses per break in the cross-tabulation.
For example: if the table analyses responses by each of five regions, and there are a total of 600 responses in the row in question. The row index will express the number of responses in each cell as a percentage of 120.